Data Discovery: Process, Methods & Best Practices Guide
Let’s be real: your organization’s data is probably sitting there like a messy attic—full of hidden treasures, dusty relics, and a few skeletons. Data discovery is your metal detector. It’s the process of sifting through all that data (yes, even the spreadsheets from 2012) to find patterns, trends, and insights that actually matter. Think of it as corporate archaeology, but with fewer fedoras and more pivot tables.
In this guide, we’ll break down the process, methods, and best practices to turn you from a data hoarder into a data whisperer. No jargon, no fluff—just actionable steps to help you mine that data gold. Let’s dig in.
🧩 What Even Is Data Discovery?
Data discovery isn’t just a fancy term for “staring at Excel until your eyes bleed.” It’s a systematic way to explore, analyze, and visualize data from every nook and cranny—databases, cloud apps, IoT devices, even Gary from Accounting’s cryptic Slack messages. The goal? To spot patterns, predict trends, and make decisions that don’t rely on gut feelings or office horoscopes.
The Nuts and Bolts
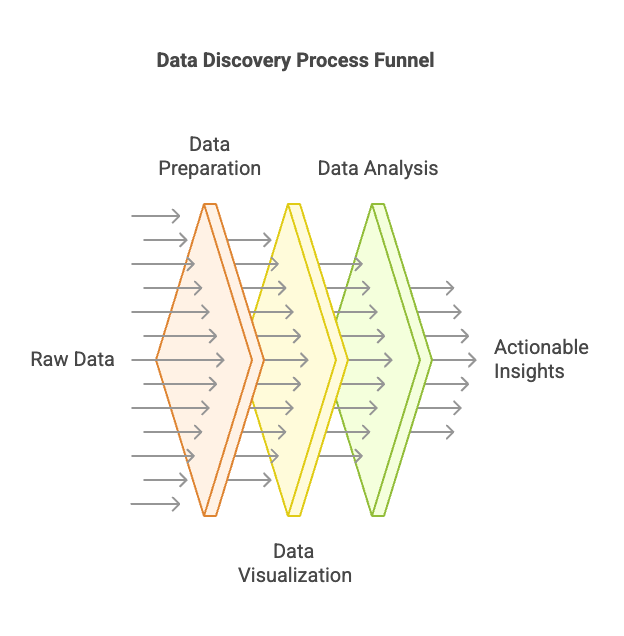
At its core, data discovery involves three pillars:
- Preparation: Cleaning, merging, and standardizing data to eliminate noise (like duplicates or formatting errors).
- Visualization: Transforming raw data into charts, graphs, or heatmaps to reveal hidden relationships.
- Analysis: Applying statistical methods or AI to extract actionable insights—like why customers churn or which products are underperforming.
Why bother? Because hidden in your data are answers to questions like: Why did sales tank last quarter? Or How do we stop customers from ghosting us? Plus, it’s a non-negotiable for staying compliant with regulations like GDPR. No one wants a privacy lawsuit because Karen accidentally emailed customer data to her knitting group.
🚀 Why Data Discovery Matters (Spoiler: It’s Not Just for Nerds)
Data discovery isn’t just for data scientists. It’s for anyone who wants to:
Still not convinced? Imagine trying to find a needle in a haystack… while blindfolded. Data discovery removes the blindfold.
Industry-Specific Wins
- Healthcare: Predict patient outcomes or optimize treatment plans using genomic data.
- Retail: Personalize marketing by analyzing buying patterns.
- Finance: Flag fraudulent transactions in real time.
- Manufacturing: Prevent equipment failures with IoT sensor analytics.
⚙️ The Data Discovery Process: 5 Steps to Glory
1. Define Your Mission
Before you dive in, ask: What problem are we solving? Are you optimizing supply chains? Stopping customer churn? Resurrecting last year’s failed marketing campaign?
- Set clear goals (e.g., “Reduce shipping delays by 20%”).
- Identify key data sources (CRM, ERP, IoT sensors).
- Map out timelines and resources.
Pro tip: Skip this step, and you’ll end up with a dashboard full of cat memes instead of insights.
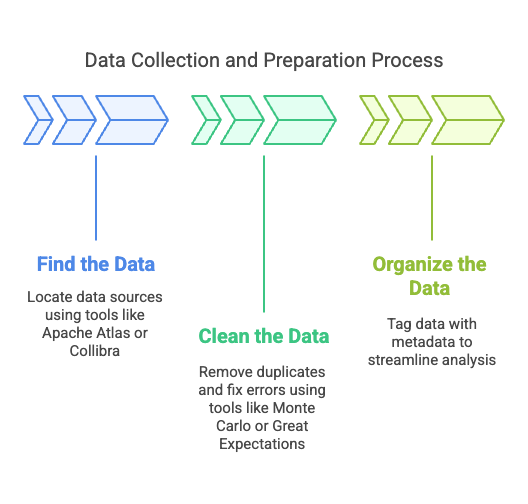
2. Collect and Prep Your Data
This is where the real work begins.
- Find the data: Check databases, cloud storage, APIs, and even that forgotten USB drive in the supply closet. Tools like Apache Atlas or Collibra can automate asset discovery.
- Clean it up: Remove duplicates, fix formatting errors, and fill in gaps. Think of it as data detox. Automated tools like Monte Carlo or Great Expectations handle this at scale.
- Organize it: Tag data with metadata (e.g., “customer PII” or “financial records”) to streamline analysis.
Need to track down elusive data? Tools like GetUser.ai can help—like when you’re trying to find a LinkedIn profile using an email or hunt down a Twitter account.
3. Visualize and Analyze
Raw data is boring. Visuals? Sexy.
- Use tools like Tableau or Power BI to create dashboards.
- Apply statistical analysis (correlation, regression) to spot relationships.
- Try clustering to group similar data points (e.g., “Which customers are about to bail?”).
Trend Alert: Interactive visualizations are replacing static dashboards. Imagine clicking a stock chart to execute a trade or using AR to explore 3D data models.
4. Level Up With Advanced Analytics
Here’s where you flex.
- Machine learning: Predict future trends (like forecasting Q4 sales). Tools like Bigeye auto-detect anomalies in datasets.
- Natural Language Processing (NLP): Analyze customer reviews or support tickets to gauge sentiment.
- Predictive modeling: Simulate “what-if” scenarios (e.g., “What if we raised prices by 5%?”).
AI Spotlight: Generative AI lets users ask questions in plain language (e.g., “Show me top-selling products”) and get instant visual answers.
5. Rinse and Repeat
Data discovery isn’t a one-night stand. It’s a relationship.
- Update data sources regularly.
- Refine models based on feedback.
- Iterate to stay ahead of market shifts.
Example: Retailers re-run discovery monthly to adapt to seasonal trends.
🤖 Manual vs. Automated Discovery: Pick Your Fighter
| Aspect | Manual Discovery | Automated Discovery |
|---|---|---|
| Best For | Sensitive data (legal docs, IP), legacy systems | Large datasets, real-time insights |
| Speed | Slow (weeks to months) | Lightning-fast (minutes to hours) |
| Accuracy | Prone to human error | AI-driven precision |
| Tools | Excel, basic SQL | Talend, IBM Guardium, Anomalo |
| Use Case | Initial data mapping for compliance audits | Monitoring petabyte-scale cloud data |
🛠️ Tools of the Trade
Data Integration
- Apache NiFi: Drag-and-drop pipeline builder for moving data between systems.
- Fivetran: Automates data ingestion from 150+ sources (Slack, Salesforce, etc.).
Visualization
- Looker: Embeds live charts into apps (e.g., inventory alerts in Shopify).
- Qlik Sense: AI-powered associative analytics for uncovering hidden trends.
Security & Compliance
- Varonis: Locks down sensitive data with granular access controls.
- Securiti.ai: Scans petabytes of data to tag GDPR/CCPA-related info.
Data Quality
- Monte Carlo: ML-driven observability to catch data drift.
- Soda Core: Open-source tool for validating datasets with SQL-like checks.
Need to track down someone’s employment history? Check out this guide.
🏆 Best Practices: Don’t Wing It
- Automate Everything
Let AI handle the grunt work. Tools like Lightup auto-scale data checks across pipelines. - Centralize Your Data
Ditch the chaos. Use a single repository (like a “data Walmart”) so everyone knows where to shop. - Keep It Simple, Smarty
Use no-code tools like Luzmo for dashboards. If your intern can’t figure it out, it’s too complicated. - Build a Data Culture
Train teams to love data. Offer snacks. Bribe if necessary. - Govern Like a Boss
Assign data stewards. Tag sensitive data with risk scores. Sleep better at night. - Privacy First
Encrypt, monitor access, and comply with GDPR/HIPAA. No one wants a front-page scandal.
❓ FAQs: Because You’re Still Curious
1. What’s the biggest challenge in data discovery?
Siloed data. It’s like herding cats—if the cats were spread across 12 platforms and two time zones.
2. How do automated tools help?
They’re speed demons. They scan, clean, and analyze data faster than you can say “machine learning.”
3. Why is visualization key?
Because nobody wants to read a 100-page CSV file. Visuals make trends obvious.
4. How do you ensure data quality?
Clean, validate, and document everything. Tools like Tamr are your janitors.
5. Best way to classify sensitive data?
Tag it early, restrict access, and monitor like a hawk. Tools like GetUser.ai can help track down loose ends.
🌟 The Future of Data Discovery
- Real-Time Insights: Live dashboards in healthcare ERs or stock trading floors.
- AI-Driven Storytelling: Tools like Luzmo turn data into narrated reports.
- VR/AR Exploration: Walk through 3D data landscapes to spot trends.
🎯 Bottom Line
Data discovery isn’t optional—it’s survival. Whether you’re a startup or a Fortune 500, the right process, tools, and mindset will turn your data from a liability into your greatest asset. Now go forth and discover. (And maybe clean up that USB drive.)
Data nerd @ GetUser.ai. Been helping sales teams work smarter with data since 2018. I dig into the nuts and bolts of email verification, lead research—the stuff that actually moves the needle.